 September 8th
 February 22nd
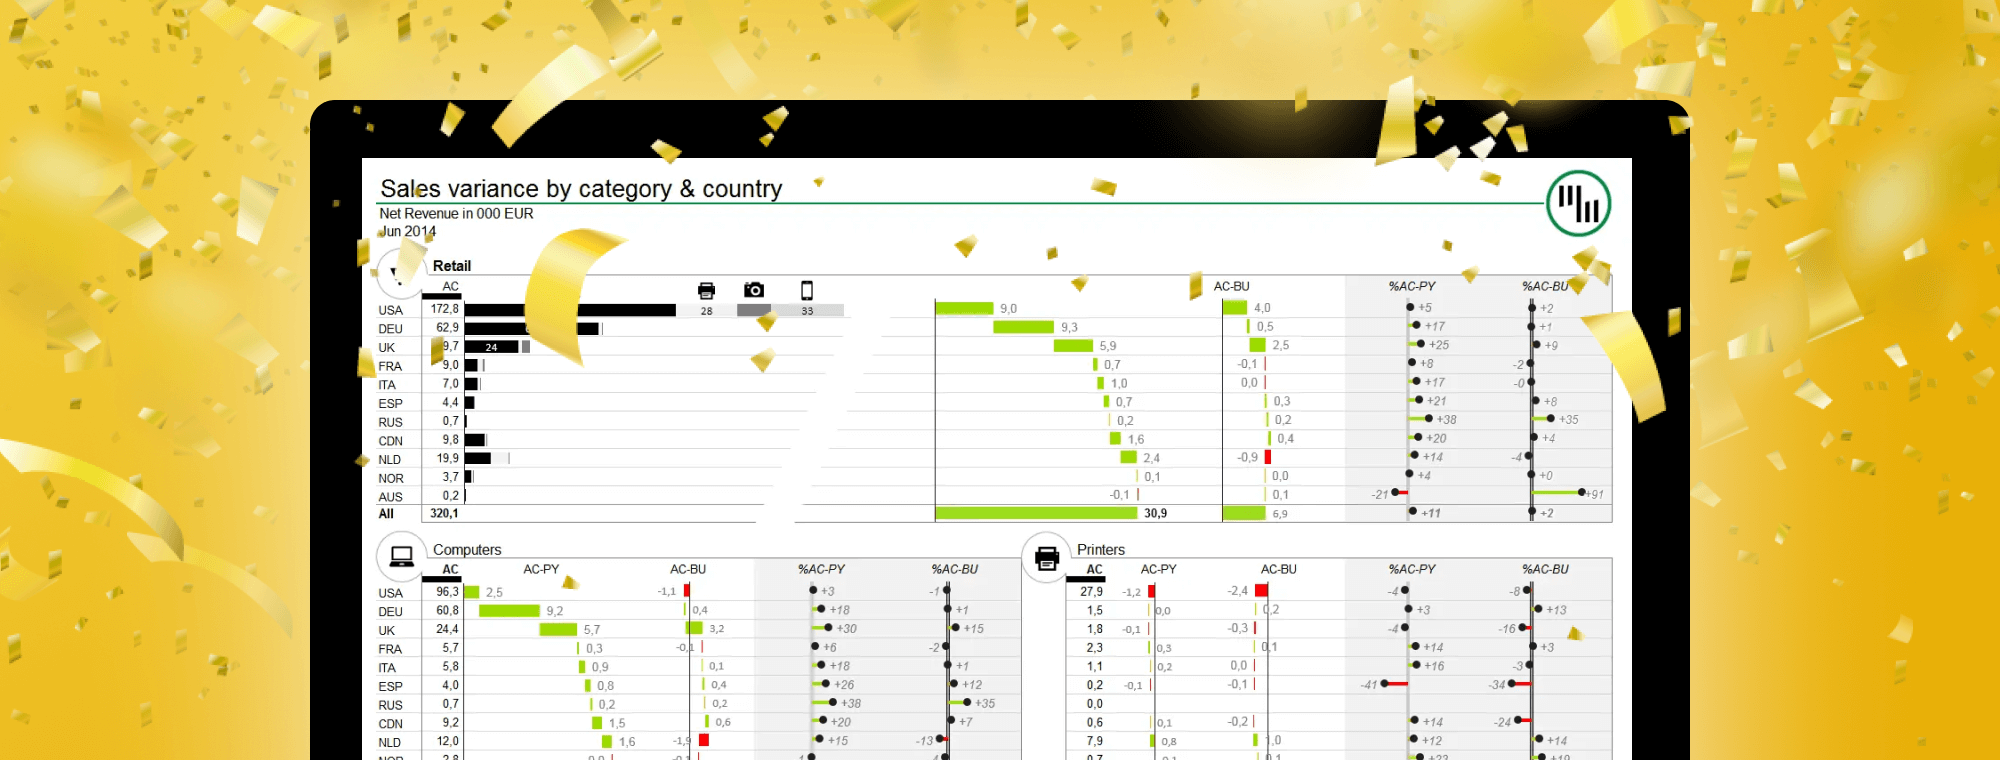
Zebra BI has been launched!
As many of you may know the HICHERT®IBCS conference is currently taking place in Frankfurt. We are present by sponsoring the event and presenting Zebra BI to a wide audience of management reporting professionals. With the official launch, we are also presenting many new features, such as one-click scaling of multiple charts, colorblind-safe color scales, enhanced charts, IBCS compliant commenting, straightforward creation of PowerPoint slides, etc.
Top new features
1. One-click scaling of multiple charts
Most users prefer to organize charts directly on the Excel worksheet. That is why people love our "Snap move" function to embed the charts into a particular range of cells. Well, now we have added a really simple, one-click option to scale a selected group of charts on the worksheet while preserving their position. Now it is even easier to design combined table-chart reports:
This scaling concept allows you to scale:
- any number of charts of the same type (e.g. 4 waterfall charts for 4 profit centers, 2 vertical bar charts for variance to PY and variance to budget, 2 dot ("pin") charts showing relative percentages, etc.)
- any number of charts of different types (for example, a column chart showing actual values and a waterfall chart showing absolute variances)
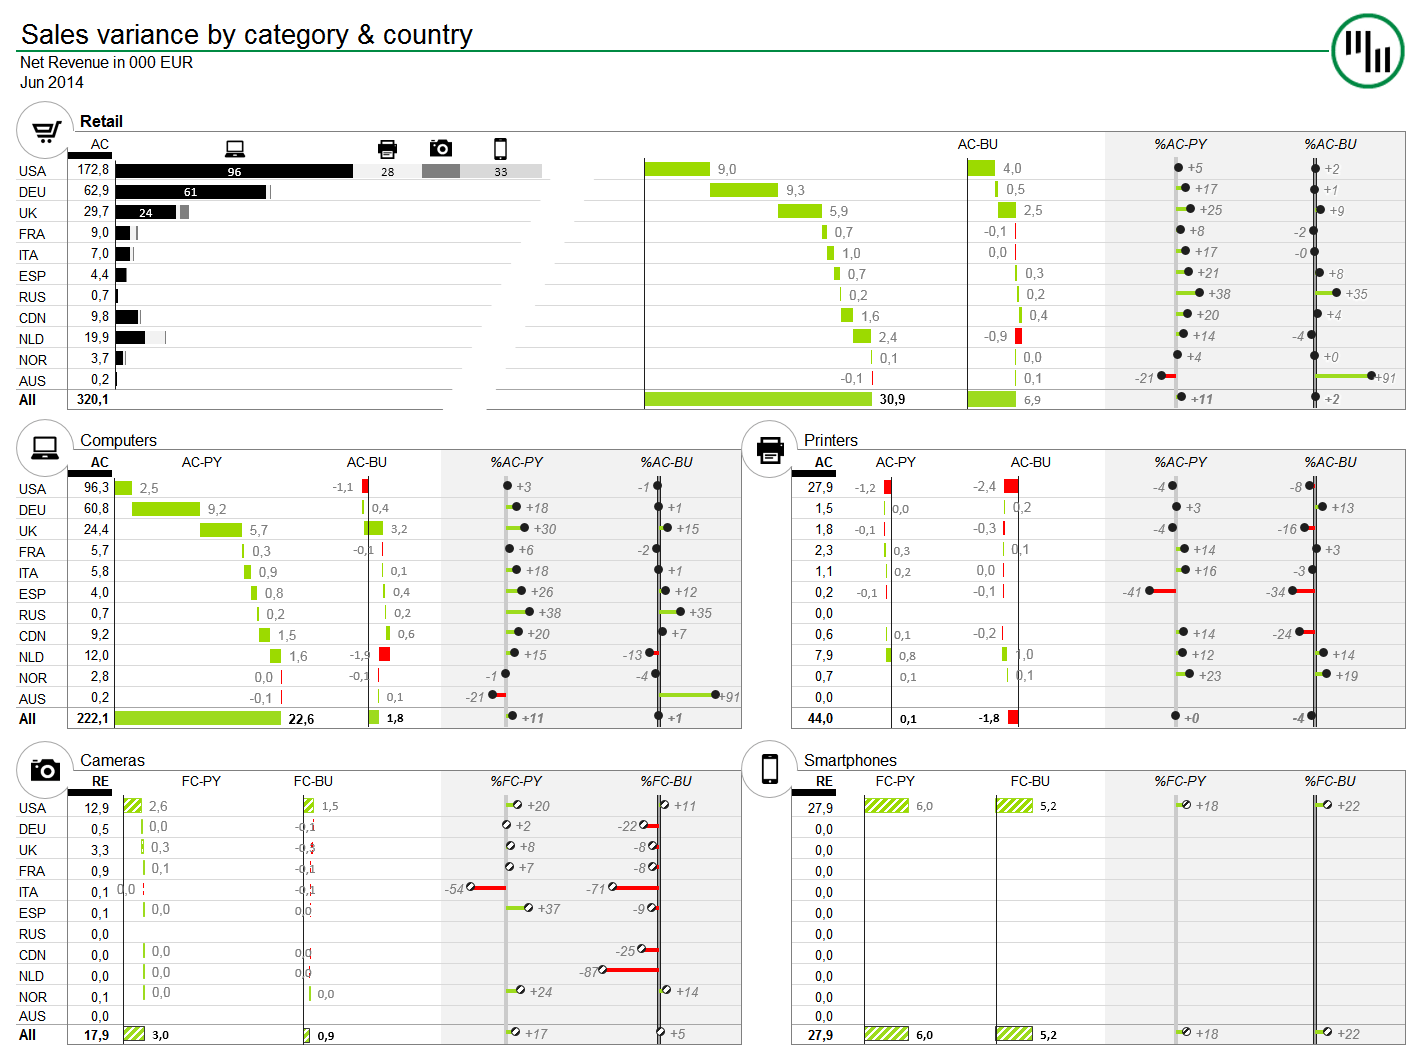
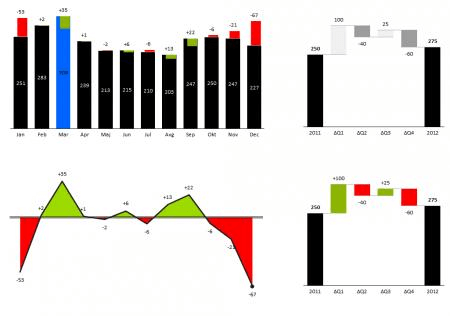
You can create any number of such scaled groups with any number of charts! If possible, always try to scale all charts that display values of the same unit (values in EUR, percentages, units sold, etc.). The new scaling concept now allows you to build professional Excel dashboards in minutes. Here is an example of a Zebra BI dashboard where two scaled groups were used - one for EUR values (waterfall charts showing absolute variances, bar charts with integrated variances from previous year) and the other for relative variances (horizontal dot charts for relative variances in %):
2. New color scales, including a colorblind-safe
Besides Dr Rolf Hichert's standard IBCS color codes, we prepared:
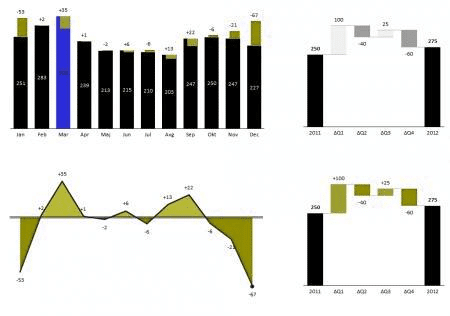
- two versions our own Zebra color schemes,
- environmentally friendly Eco color scheme that will save ink in your printer cartridges
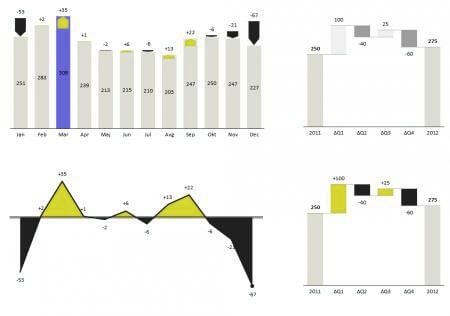
- Colorblind-safe scheme for people with color vision deficiencies and
- B&W Printer for situations where printing on black and white printers is still the predominant way of distributing reports.
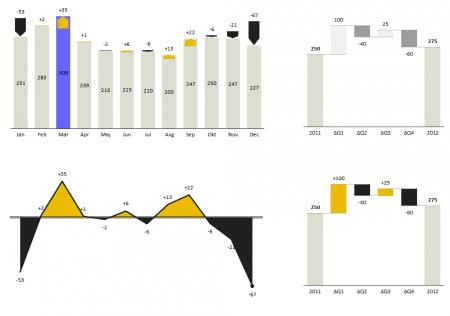
Did you know that 8% of Caucasian men are affected by red-green color blindness? And that green plants absorb most chlorophyll at 400nm wavelength? We have considered facts like this when designing Zebra BI.
Our commitment to place the user's experience in the first place in all product-related decisions has to lead us to design the Colorblind-safe color scheme. Why? Firstly, 8% is already a considerable share of users. Secondly, IBCS and also our own color schemes heavily rely on red-green color codes for obvious reasons, meaning that people with color vision deficiencies will have problems with the most important parts of reports or dashboards... The following simulation shows how colorblind users see the reports in IBCS (or similar) color schemes:
3. Enhanced "Actual + Variance" chart
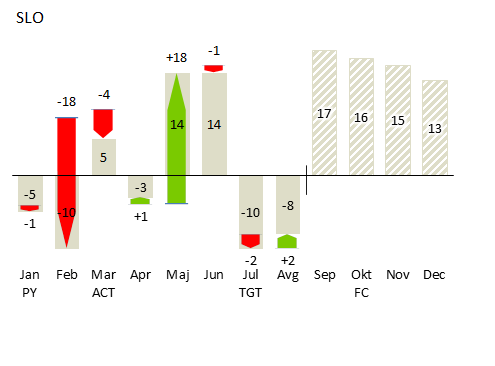
Our "Actual+Variance" chart now handles situations where either the base or comparison value is negative. This may typically occur with EBIT/Income values, if for example there was a loss in the previous year, but now - hopefully 😉 - you have profit. The variance will be displayed all the way across the axis from the negative side to positive.
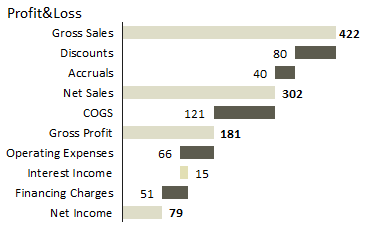
4. Two versions of Waterfall chart
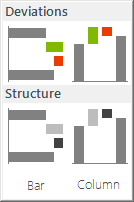
We now offer two versions of Waterfall chart: (1) contribution of variances and (2) structure. The one with red-green columns is suitable to analyze the contribution of variances to the absolute value, while the other is used for analyzing structures (such as Profit&Loss or Income statements, Gross-to-Net calculations, etc.).
Other improvements
- 1-click export of charts, groups or whole Excel ranges to PowerPoint, dynamically linked PowerPoint or PDF
- 1-click insertion of comment elements
- sorting small multiples by trend
- customizing the number format of data labels by applying the unit symbol
- pixel-perfect label positioning to 0,3FS,
- automatic detection of % values in your source data,
- labels automatically change to white color on dark backgrounds,
- many other enchancements
We hope you will continue to enjoy using Zebra BI with it's new features. Don't hesitate to write to us if you feel there is something still missing!
How do I order Zebra BI?
Those of you, who have already preordered Zebra BI will receive download instructions shortly. If you have not yet ordered your copy of Zebra BI there is still a chance for you to get it for the price of 19.90 EUR/month.